

New Certification – AI Data Center Infrastructure
Data Center Training & Certifications
Data Center Design, Operations and Maintenance, High Availability, Reliability, Systems and Components, Energy Efficiency. Train and be certified with SERES.
15+
Years of Industry Expertise
4
Global Regions
50+
Countries Reached
100%
Live Online Delivery
Featured Programs
Train and be certified with SERES
SERES has developed Professional Certification programs across the most critical disciplines of modern data center operations.
New Certification – AI Data Center Infrastructure
Designing, managing and optimizing infrastructure for AI workloads — GPUs, TPUs, high-density cooling.
Learn more →Rack Density Categories
New framework classifying rack densities from LD to EHD in the age of AI.
Learn more →DCEP Training
DOE Data Center Energy Practitioner — Generalist, IT, HVAC and Electrical Specialist.
Learn more →DC Training
Design, operations, maintenance, reliability and energy efficiency fundamentals.
Learn more →Downtime Severity Levels
A measurement scale to assess the impact and depth of downtime in data centers.
Learn more →SERES Certifications
Professional certifications validating knowledge across critical data center domains.
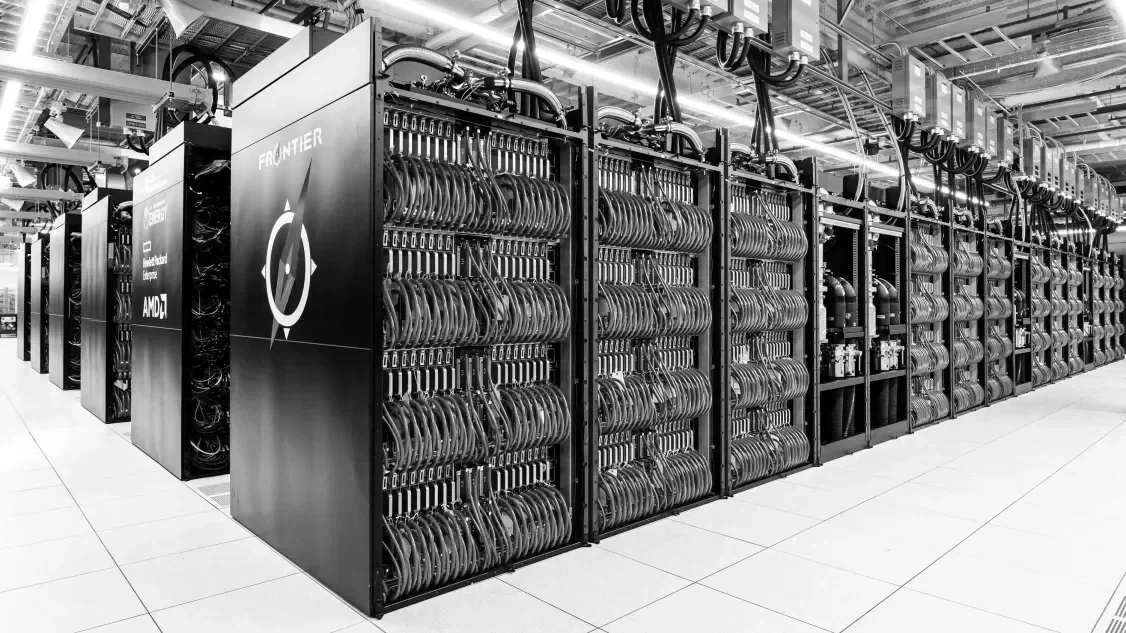
Learn more →AI Data Center Training
Certified Professional AI Data Center Infrastructure
A comprehensive program covering the unique requirements, challenges, and best practices for AI-centric data centers — power, cooling, sustainability, and safety for high-performance AI systems.
N E X T C O H O R T
Sept 7–8, 2026
USA / Canada · Live Online
Fundamental differences in AI vs. traditional IT workloads

Power & cooling for high-density GPU/TPU hardware
Scalability, redundancy and fault tolerance for AI
Sustainability and clean power generation sources
Certifications
Professional credentials that matter
SERES is a Partner Training Organization licensed to deliver the DCEP (Data Center Energy Practitioner) program.
DCEP Generalist
IT, Air Management, Cooling and Electrical disciplines.
DCEP IT Specialist
IT energy usage, asset performance and metering.
DCEP HVAC Specialist
Air handlers, liquid cooling, chilled water plants.
DCEP Electrical Specialist
Fundamentals, power train, metering, UPS equipment.
Outstanding Research Work
Pioneering research from SERES
Original research that shapes the industry — from PUE modeling to rack density classification.
Divide and Conquer
Impact of Modular Design on PUE
Rack Density Categories
Classification in the Age of AI
Demystifying PUE
Energy savings through PUE improvement
Downtime Severity Levels
Measuring impact of downtime
Cooling Technologies
Matched to rack density categories
IT Room Utilization
ITRU set of equations
Global Outreach
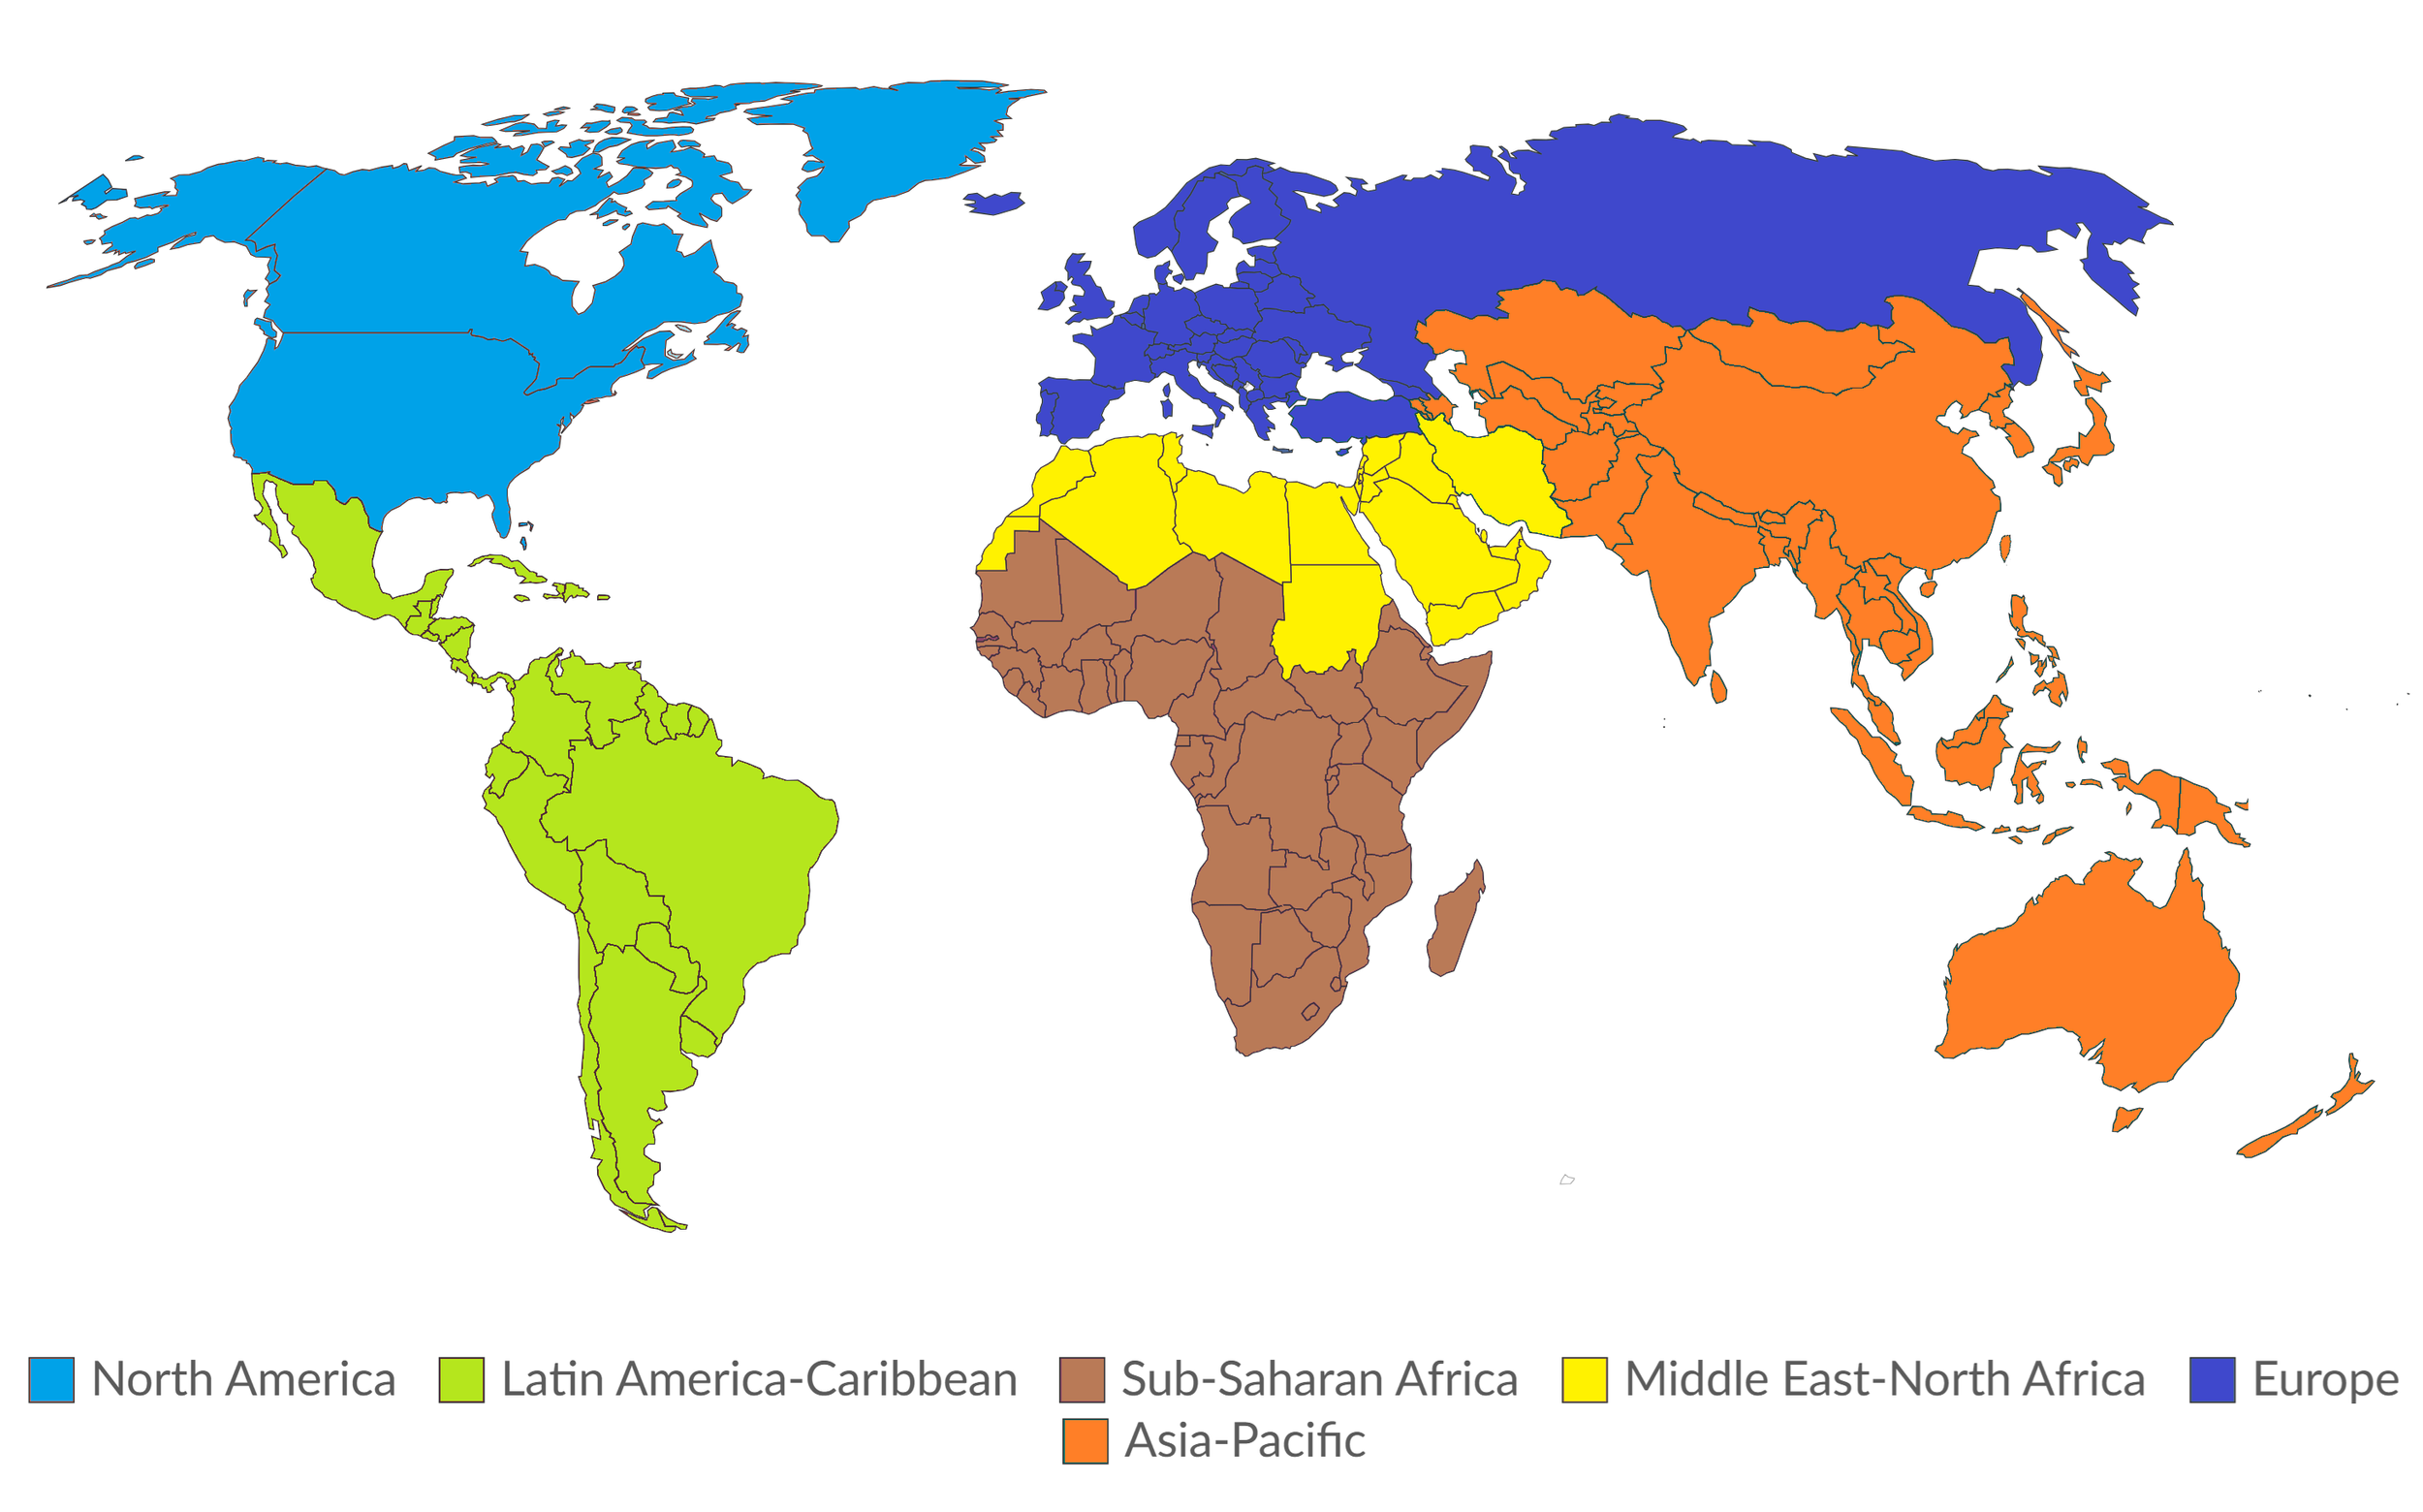
Training data center professionals across the world
SERES has instructed Data Center training to companies across the world. We are currently expanding our training offering to new territories.
USA / Canada
MDT (GMT -7)
EMEA
GMT +3
APAC
GMT +9
New Framework
Classification of Rack Densities
A new framework that considers Rack Density categories in an exponential binary growth
LD
01Low Density
0 – 5 kW
LD 0 – 5kW
Switches, Routers, IDS/IPS,
Firewalls/VPN
MD
02Medium Density
5 – 10 kW
MD 5 – 10kW
Entry-Level Servers, NAS,
Core Switches/Routers
HD
03High Density
10 – 20 kW
HD 10 – 20kW
Enterprise Servers, SANs
AIR – Water ChillersVHD
04Very High Density
20 – 40 kW
VHD 20 – 40kW
Blade Servers, High-End
Servers (Enterprise HPC)
UHD
05Ultra High Density
40 – 80 kW
UHD 40 – 80kW
AI Systems / AI Clusters / HPC
LIQUID – RDHX / D2CSHD
06Super High Density
80 – 160 kW
SHD 80 – 160kW
AI Systems / AI Clusters / HPC
LIQUID – D2C / ICEHD
07Extremely High Density
160 – 320 kW
EHD 160 – 320kW
AI Systems / AI Clusters / HPC
LIQUID – D2C / ICVEHD+
08Future EHD Tiers
320 kW – 5.1 MW
Future EHD Tiers
EEHD 2650 – 5120kW
SEHD 1280 – 2560kW
UEHD 640 – 1280kW
VEHD 320 – 640kW
DCEP Programs
Data Center Energy Practitioner Certification
Data centers are energy-intensive — DCEP certifies practitioners qualified to identify and evaluate energy efficiency opportunities. Be certified and get your DCEP logo.
Trusted by data center professionals at companies worldwide
Webinars, Trainings, Certifications…
Join the next SERES cohort and accelerate your data center expertise.